This example illustrates how to create 4D volume data graphs. You can find the data in the file setuppath\ samples\data\regular4d.txt,
here setuppath is the setup path of Visual Data Pro in your computer, for example, c:\program files\Visual Data Pro.
1. Click  button. button.
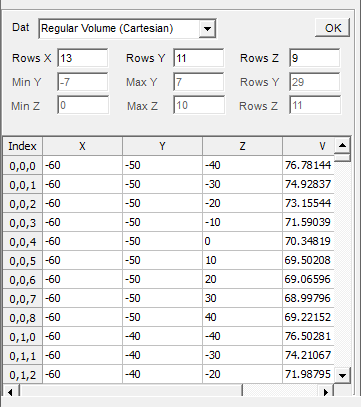
2. Click Import Data ... item from File menu to import data from the file setuppath\ samples\data\regular4d.txt. The size of the data is
13*11*9. You can see them in Data Edittor.
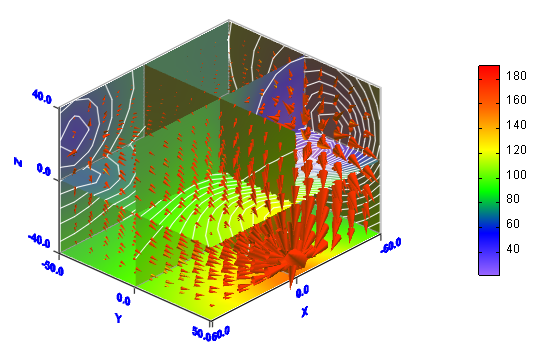
3. Click button in Standard toolbar to open 4D Slice Properties dialogbox. In YZ Direction tab: input -60 in Input A X Value textbox, input 1 and 11 in Rows Y From textbox and To textbox,input 1 and 9 in Rows Z From textbox and To textbox, click Add button input 0 in Input A X Value textbox, input 1 and 11 in Rows Y From textbox and To textbox,input 1 and 9 in Rows Z From textbox and To textbox, check Add Color Map and Add Contour checkbox, click Add button. In ZX Direction tab: input -50 in Input A X Value textbox, input 1 and 9 in Rows Z From textbox and To textbox, input 1 and 13 in Rows X From textbox and To textbox, click Add button input 0 in Input A X Value textbox, input 1 and 9 in Rows Z From textbox and To textbox, input 1 and 13 in Rows X From textbox and To textbox, check Add Color Map and Add Contour checkbox, click Add button. In XY Direction tab: input -40 in Input A X Value textbox, input 1 and 13 in Rows X From textbox and To textbox, click Add button input 0 in Input A X Value textbox, input 1 and 11 in Rows Y From textbox and To textbox, check Add Color Map and Add Contour checkbox, click Add button. button in Standard toolbar to open 4D Slice Properties dialogbox. In YZ Direction tab: input -60 in Input A X Value textbox, input 1 and 11 in Rows Y From textbox and To textbox,input 1 and 9 in Rows Z From textbox and To textbox, click Add button input 0 in Input A X Value textbox, input 1 and 11 in Rows Y From textbox and To textbox,input 1 and 9 in Rows Z From textbox and To textbox, check Add Color Map and Add Contour checkbox, click Add button. In ZX Direction tab: input -50 in Input A X Value textbox, input 1 and 9 in Rows Z From textbox and To textbox, input 1 and 13 in Rows X From textbox and To textbox, click Add button input 0 in Input A X Value textbox, input 1 and 9 in Rows Z From textbox and To textbox, input 1 and 13 in Rows X From textbox and To textbox, check Add Color Map and Add Contour checkbox, click Add button. In XY Direction tab: input -40 in Input A X Value textbox, input 1 and 13 in Rows X From textbox and To textbox, click Add button input 0 in Input A X Value textbox, input 1 and 11 in Rows Y From textbox and To textbox, check Add Color Map and Add Contour checkbox, click Add button.
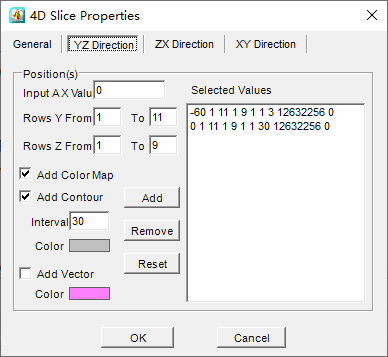
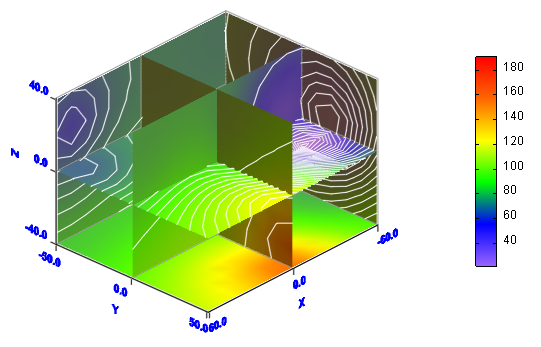
Click OK button to create the slices.
4. Click button in Standard toolbar to open 4D Vector Properties dialogbox. Set color of the vectors to be red. button in Standard toolbar to open 4D Vector Properties dialogbox. Set color of the vectors to be red.
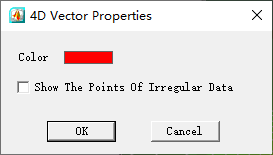
Click OK button to add the vectors.
Visual Data Tutorials |
|
